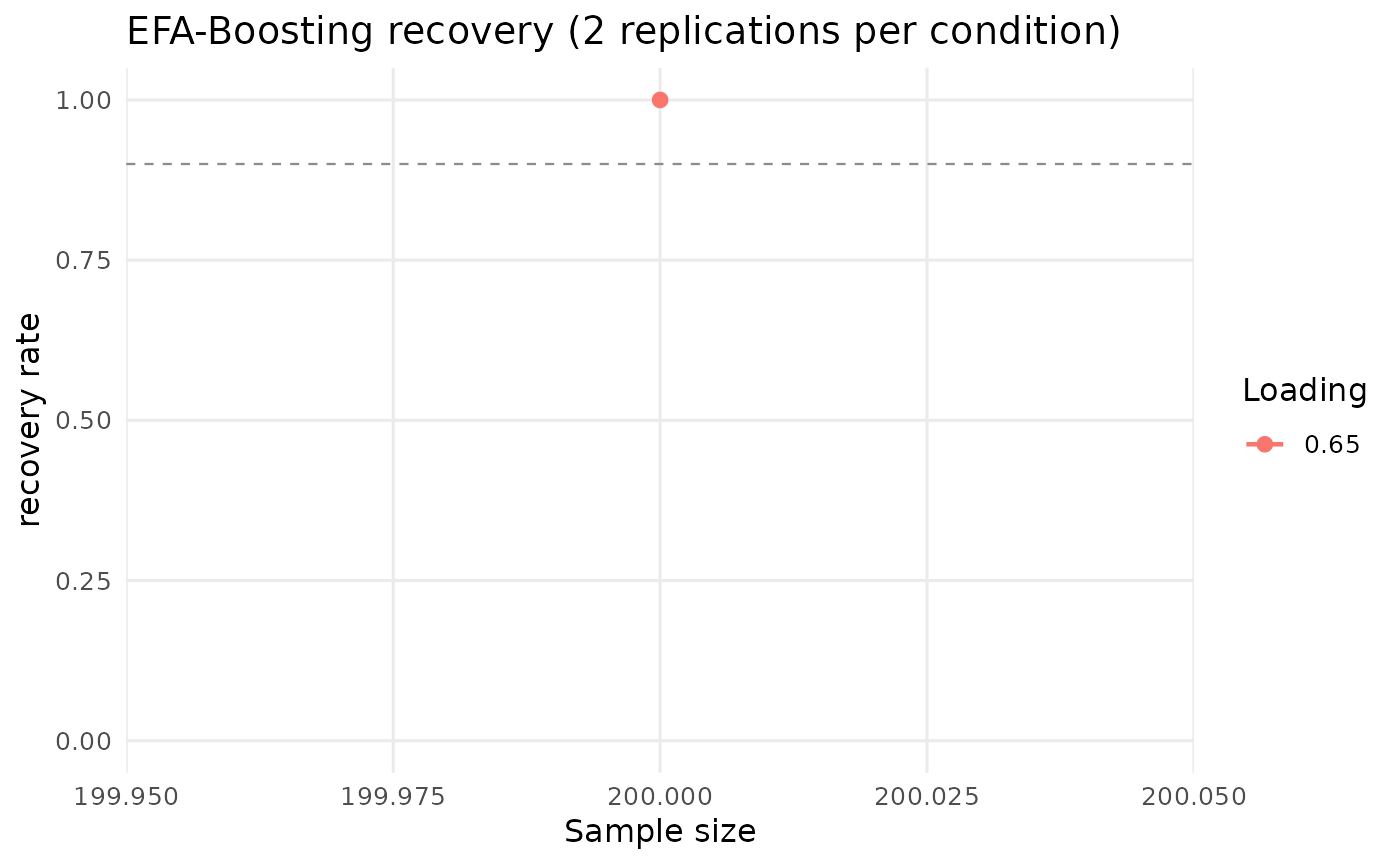
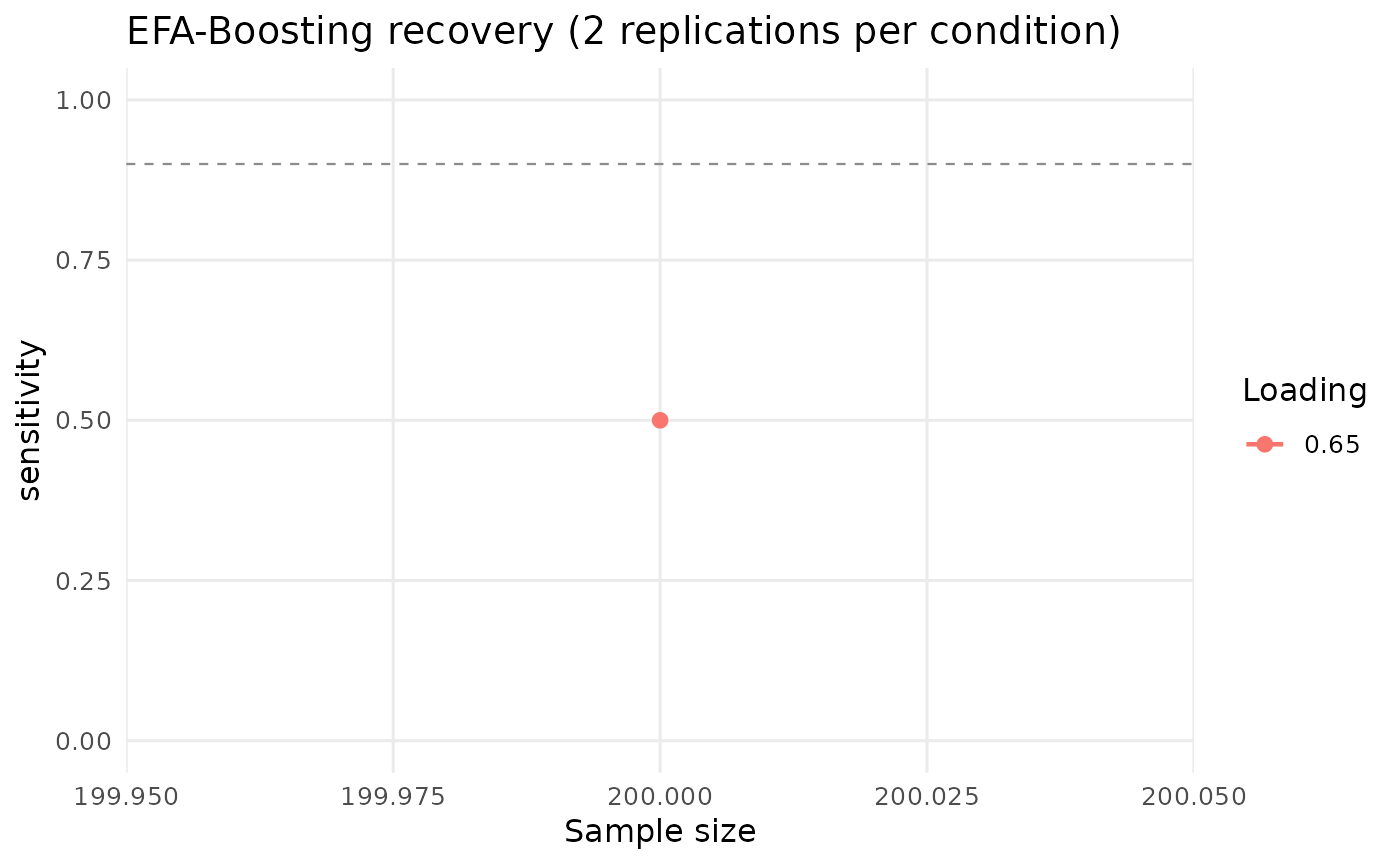
Draws the recovery curve of a simulate_recovery design: the
chosen metric against sample size, one line per population loading and one
panel per number of items per factor. This is the figure a validation paper
reports, so the crossed design is worth running with enough replications for
the curve to be stable.
Examples
# \donttest{
sim <- simulate_recovery(n = 200, n_reps = 2, seed = 1)
#> Condition 1/1: N=200, lambda=0.65, items/factor=5 (17 items total)
#>
[ ] 0% (0/2) elapsed 0s left ~?
[============= ] 50% (1/2) elapsed 9s left ~9s
[==========================] 100% (2/2) elapsed 12s left ~0s
plot(sim)
#> `geom_line()`: Each group consists of only one observation.
#> ℹ Do you need to adjust the group aesthetic?
 plot(sim, metric = "sensitivity")
#> `geom_line()`: Each group consists of only one observation.
#> ℹ Do you need to adjust the group aesthetic?
 # }